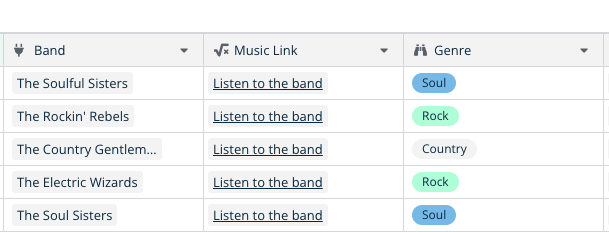
I have a table with music bands. Each band has a genre that is shown in a single select field: .
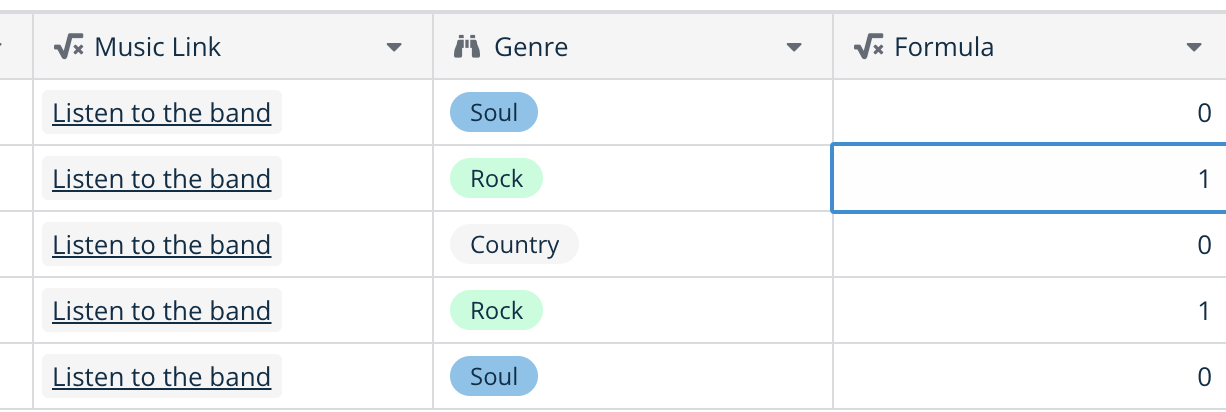
I want to add a new field with a formula that counts the number of times each genre appears in the table. In the screenshot above, this would be 2 for Rock and Soul and 1 for Country. However, the count function only returns the number of items in an array which is always 1 in my case (because a band has 1 genre).
Is this possible with a formula? I am actually looking for the equivalent of the COUNTIF function in a spreadsheet.
Thanks for the reply, but the formula does not work like I expected. It shows me that the genre Rock appears 0 or 1 time in the row. But I would like to know how many times a genre appears in the table (or view).
So, based on the screenshot above, this should be 2 for Rock and Soul and 1 for Country. I am not sure if this is possible with a formula, since formulas are only executed row by row (I think)
Make a formula field per Genre and use the footer aggregation sum for each field (you can mouse over the footer of a field to set an aggregation)
Link to every row in this table in a new “Summary” table, and write a formula over that summary row.
Really what this sort of query wants is some sort of group by/pivot view which is on our roadmap.
Alternatively we have vague plans to add some sort of formula function that lets you do proper joins without having to use a link row field. Or perhaps the ability to set a link row field to join using a formula instead of being manual.
Thanks for offering the options, but they are a bit too complex for what I want to achieve.
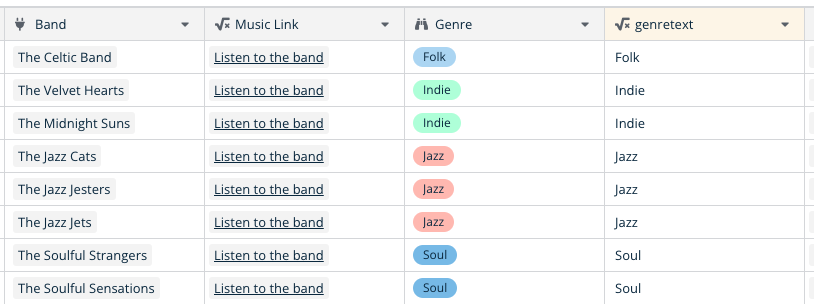
I just like to see if every genre is represented more or less equally. So, I created a new view, added a field where I convert the single-select to text and sort on that field. Using a different color for every genre also shows me if a genre occurs a lot or not.
 .
.