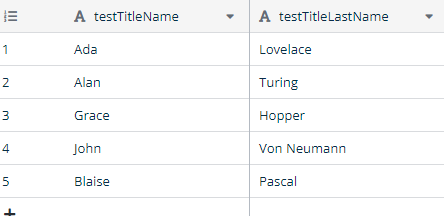
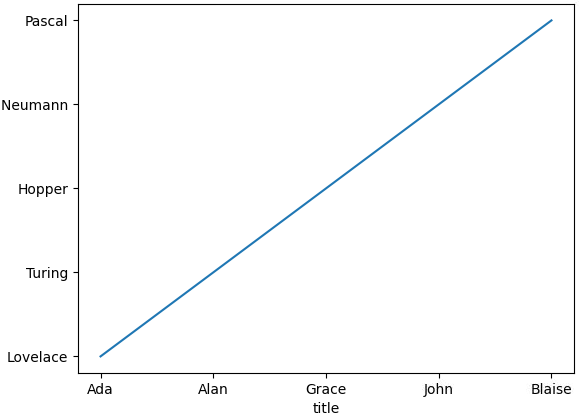
I’m happy with your feedback. Something I noticed in the previous example is that the code I submitted is very simplified. Then, I recreated this same example, and use more stuff. For example, here I made an example from scratch without any external libraries.
import requests
import json
import matplotlib.pyplot as plt

def Connect(add_id_table, add_token_baserow):
  return requests.get("https://api.baserow.io/api/database/rows/table/"+add_id_table+"/?user_field_names=true", headers={"Authorization": "Token "+add_token_baserow})

def listDatabase(add_property_name):
  viewList = json.loads(json.dumps(Connect('add_id_table','add_token_baserow').json()))
  return viewList[add_property_name]

def dataList(value):
  return enumerate(value)

testTitleName = []
testTitleLastName = []
for index, item in dataList(listDatabase('add_property_name')):
  testTitleName.append(item['testTitleName'])
  testTitleLastName.append(item['testTitleLastName'])

plt.plot(testTitleName, testTitleLastName)
plt.xlabel('title')
plt.ylabel('dataTitle')
plt.title('My first graph with baserow-api, matplotlib, json, requests!')
plt.show()
| Data I used were these | This can generate something like |
|---|---|
 |
 |
Don’t forget that the free plan has limitations
Please, see this: Baserow free tier limits
1.1 Maximum of 3.000 rows per group/workspace in free plan(Baserow)
1.2 Maximum of 2GB of storage in free plan(Baserow)
1.3 Maximum of 1.000 monthly API requests in free plan(Baserow)
1.4 Support via the community, tutorials, FAQ, user docs in free plan(Baserow)