Hey guys.
1. Disclaimer
1.1 I would like to contribute to this specific topic: View: Graphic mode - Graphic mode in Baserow. Initially, I thought I’d respond here instead of the topic, since I’d rather do an initial demo
1.2 Please, see this topic: python-baserow-client. Here is information on how to list the data stored in the baserow through the python-baserow-client library.
1.3 Maybe this request: (View: Graphic mode - Graphic mode in Baserow.) makes sense here: pyhton-baserow-client. Perhaps if someone creates an issue on GitHub of this open project it could be implemented or not this open feature. In my humble opinion, it would make sense to request a graphical rendering engine or mode in opensource libraries that uses baserow. But maybe I’m wrong in that remark here.
1.4 Maybe this can be easily solved with two libraries written in python: python-baserow-client, pyChart.js or plotly. In theory you can choose any rendering library in any programming language, as long as there is a library that communicates with the baserow.
2. Basic Algorithm
2.1. Select the library that communicates with baserow, there are several in nodejs, python or php. Here in my example, I selected the library baserow-python-client.
2.2. Select a graphics library in some programming language that you know. Here I selected the library plotly.
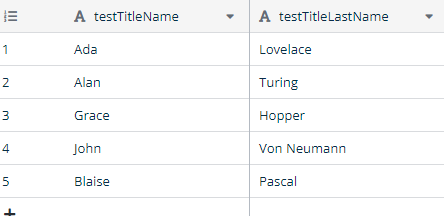
2.3. List the data and import it into an array. In computer science, an array is a data structure consisting of a collection of elements ( values or variables ), of same memory size, each identified by at least one array index or key.
2.4. View the listed data within an array
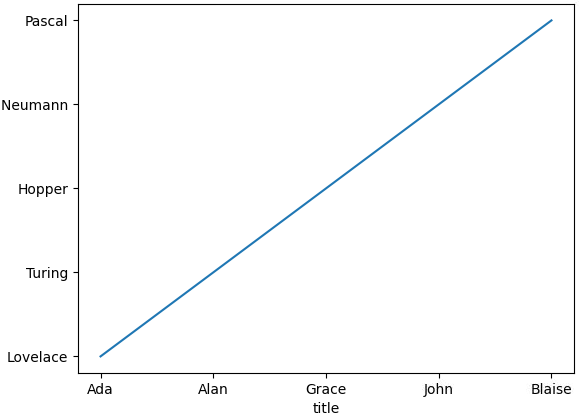
3. Idea or demo
In this basic algorithm, we use the baserow-python-client library with the plotly library to generate dynamic graphs. The purpose of this code is for demonstration only. Baserow is a great nocode openssource database tool as an alternative to Airtable and there are several libraries who communicate with baserow.
import plotly.express as px
from baserow.client import BaserowClient

client = BaserowClient('https://baserow.io', jwt='...')
# fig = px.bar(x=["a", "b", "c"], y=[1, 3, 2]) # fig.show()

for db in client.list_all_applications():
  px.bar(x=[t.name for t in db.tables], y=[db]).show()
Hope this helps ![]()