View: Graphic mode - Graphic mode in Baserow

reason

It would be interesting to visualize the data in some graphical visualization mode,
maybe visualize as a bar graph or the pie graph, people who are not very knowledgeable in data management could visualize reports on the data, that is, visualize graphically what this data represents

would be something like

my idea

I agree! It would be interesting to have some sort of “dashboard” view where you can add all kinds of charts based on the data in the table. Sharing it publicly could be very valuable to the user because he could share statistics on his website or share with co-workers.

1 Like

Perhaps you could use Rawgraphs to do stuff like that.

3 Likes

Thanks for the feedback and this is really interesting

maybe a better solution: Mito

Python data analysis in seconds
If you can edit an Excel file, you can now write code.

2 Likes

This looks cool indeed. I guess the issue is that every time you wish to visualize you need to import data again, right? There is no way of creating a sync between baserow and rawgraphs; or baserow (+googlesheet) + data studio, right?

1 Like

Hey @shaping-horizons,

If you wanted to do Baserow > Google Sheets > GDS there are ways you can make it happen, I have just spent a couple of minutes testing this with n8n.io.

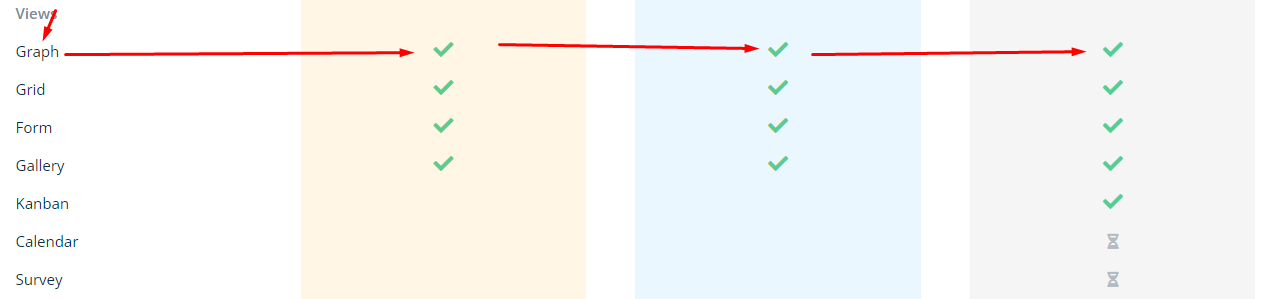
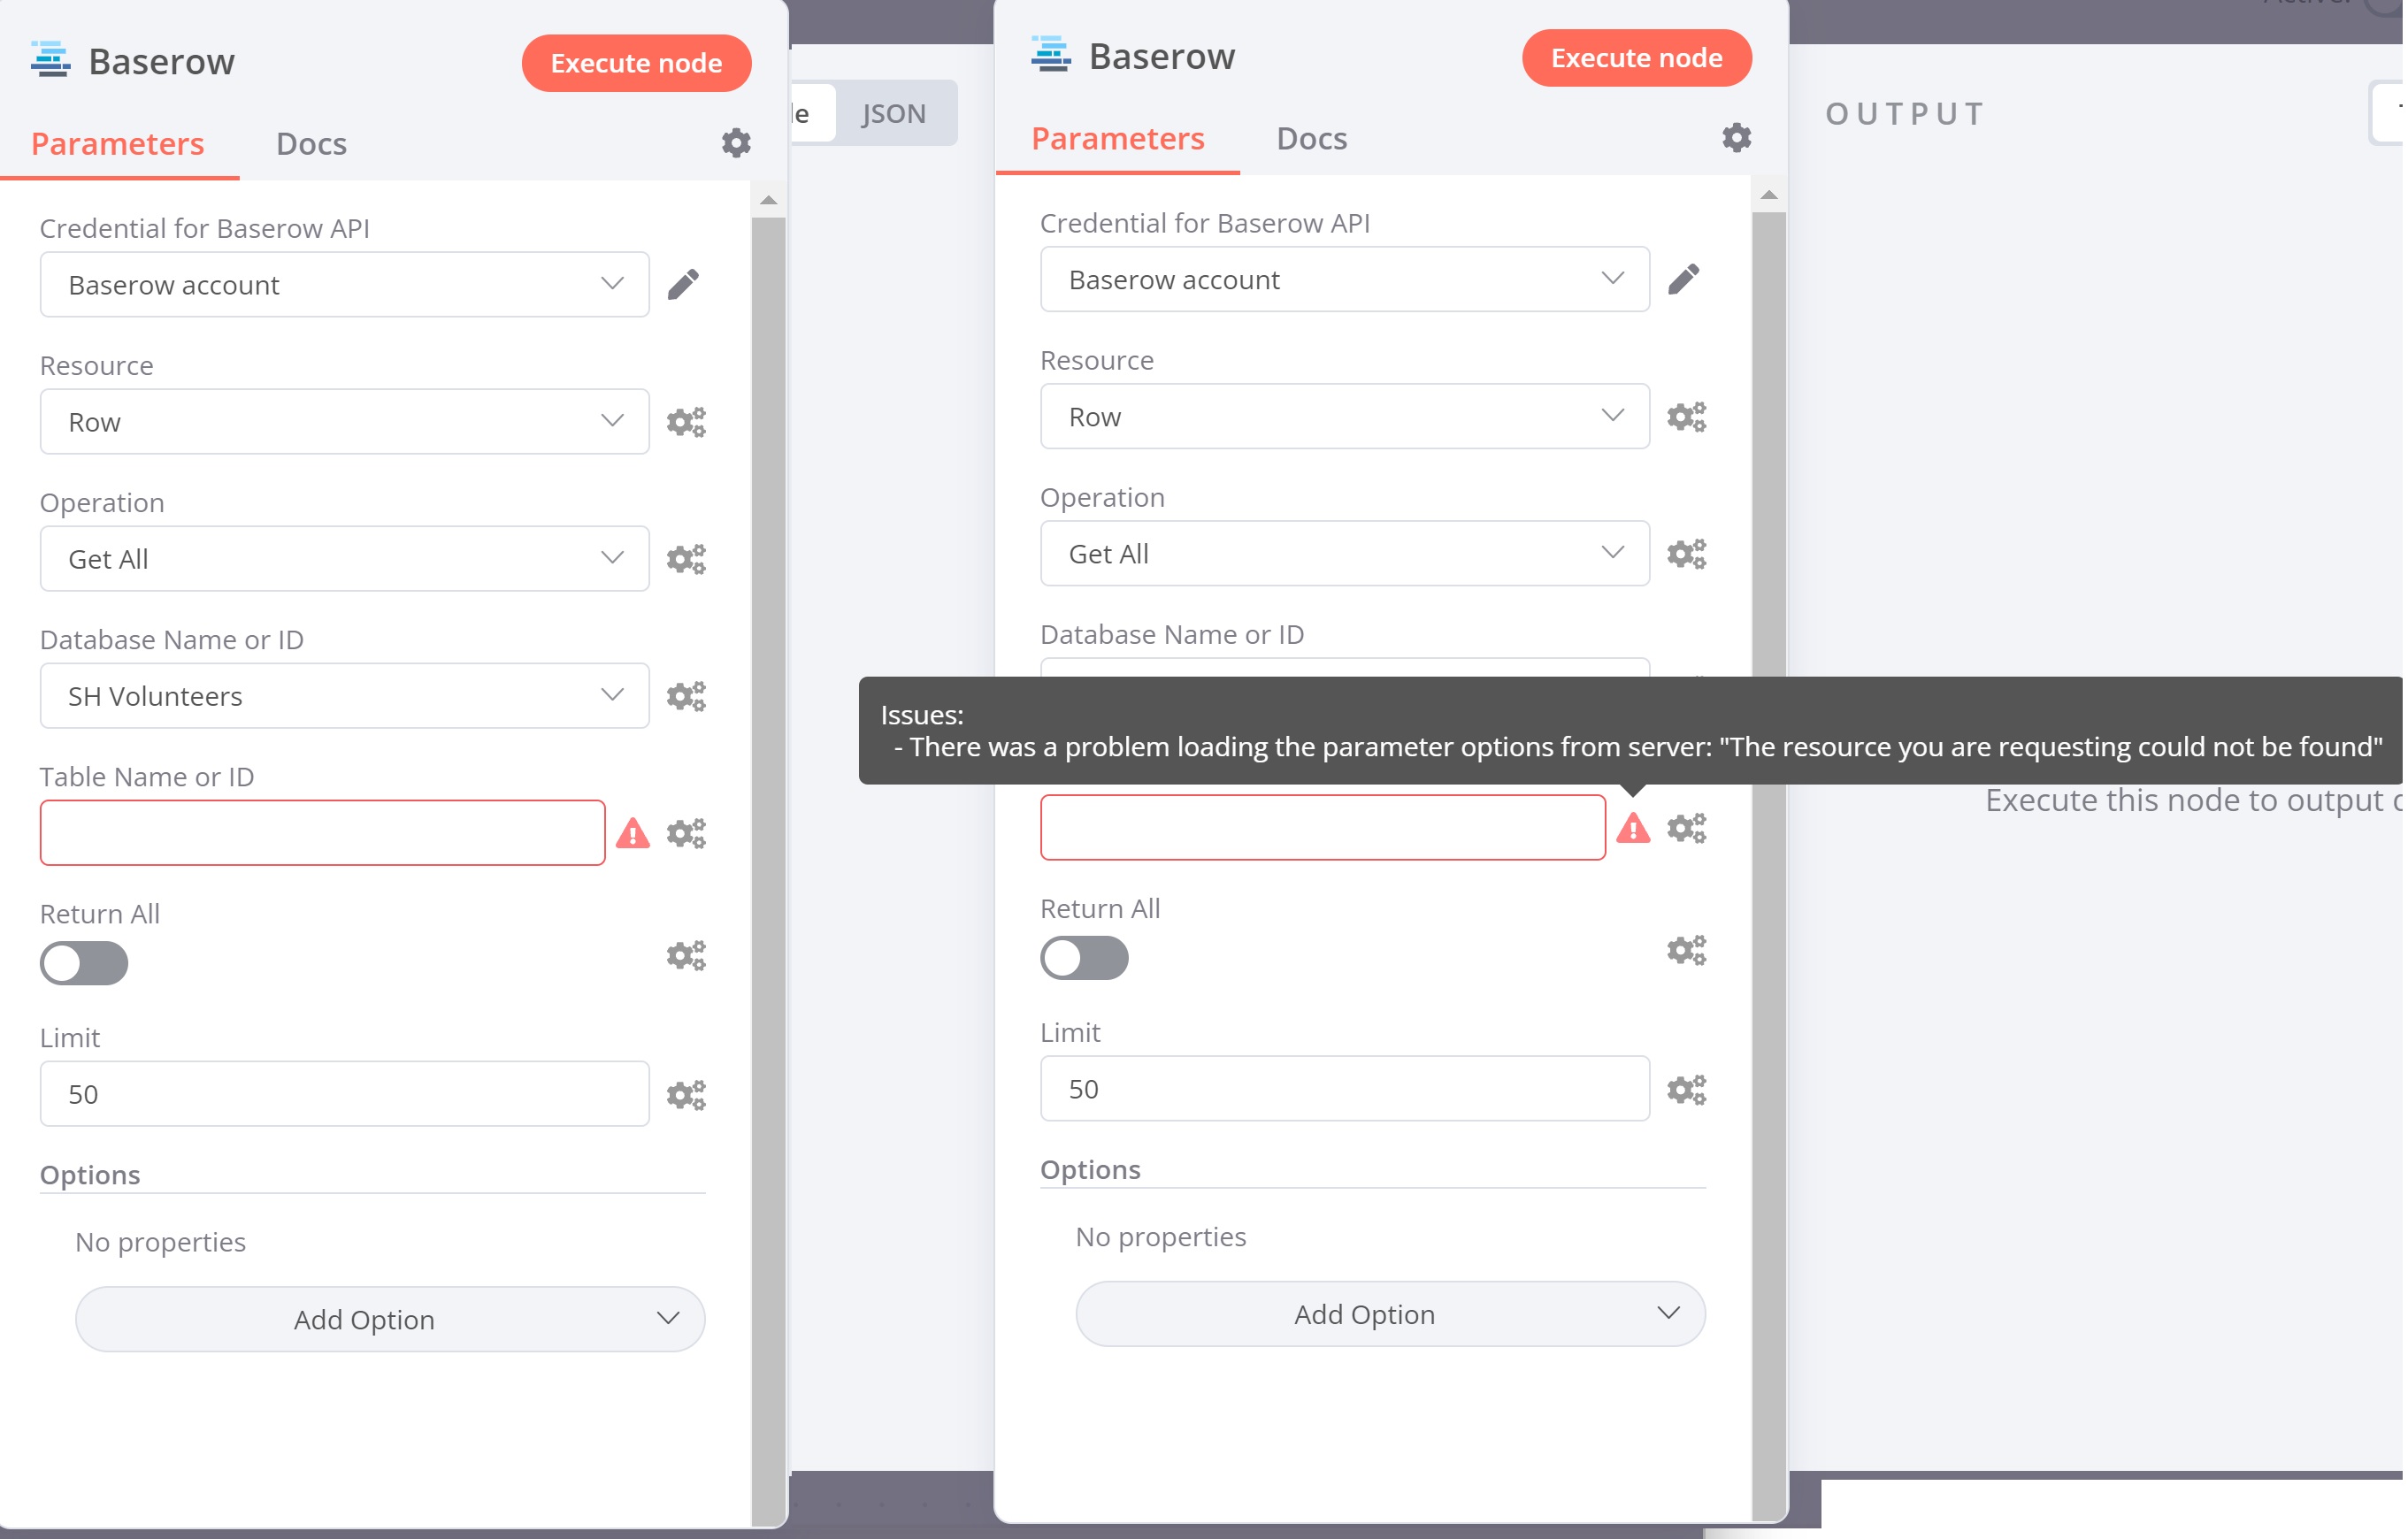
So I use Baserow to store a list of our community nodes in, This is my sample dataset I will be using. In Baserow this looks like this…

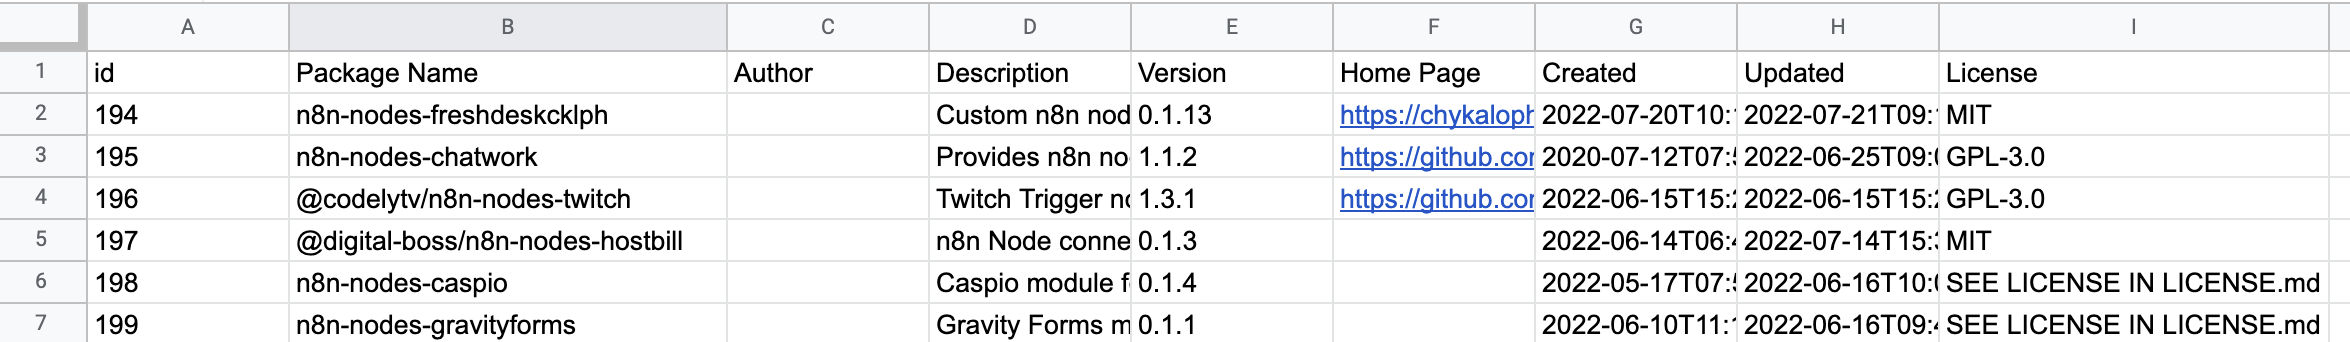
So from this I go to Google Sheets and add in the columns I want to keep.

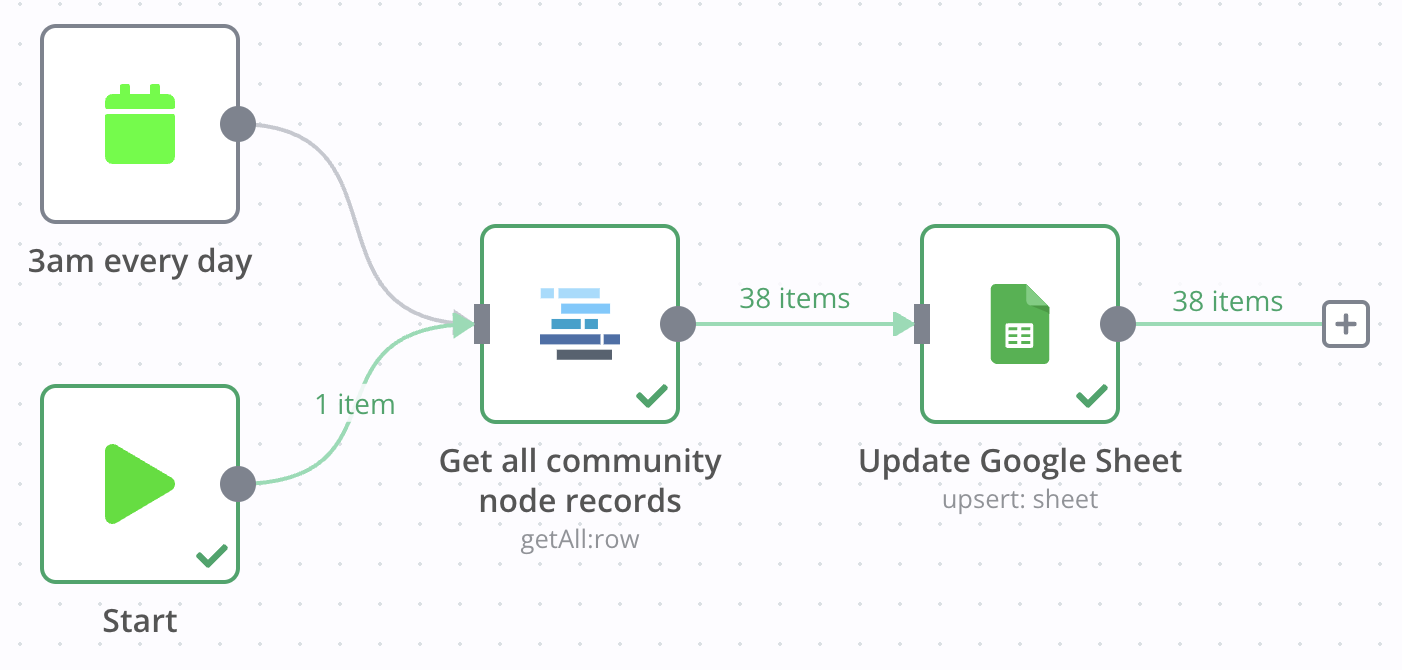
Now in n8n I make a quick that looks like this…

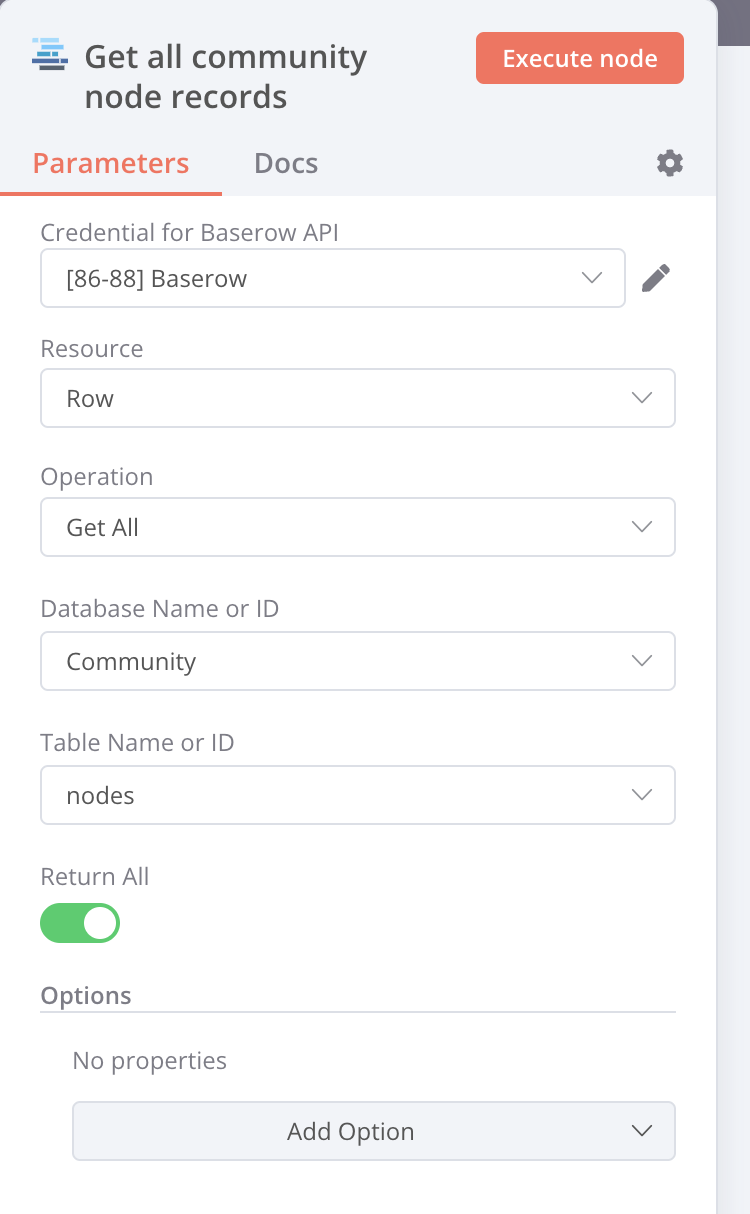
What this does is every morning at 3am it will connect to Baserow and pull all the records.

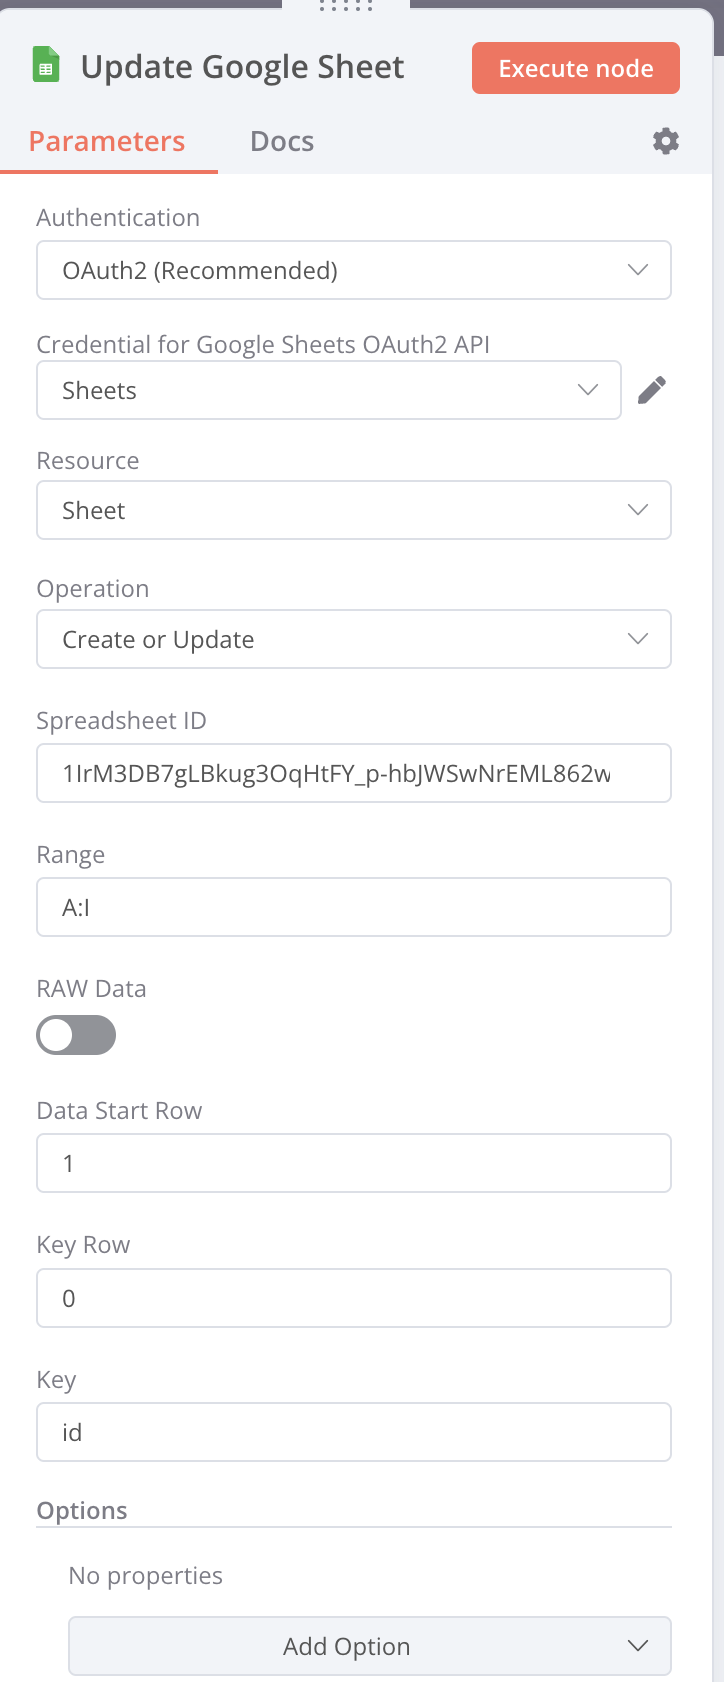
It will then Update or insert the records into the google sheet based on the incoming header items.

Once ran in my Google Sheet I now have the information that I wanted from Baserow and can connect it to GDS in the normal way.

There is an example workflow below if you wanted to give it a bash, You could also probably do the same thing with Zapier or Make but this is the way I know, Hopefully it helps.

Example Workflow
{
  "nodes": [
    {
      "parameters": {},
      "id": "4c7ea0a7-5bd8-401d-ac84-83bc48a20b07",
      "name": "Start",
      "type": "n8n-nodes-base.start",
      "typeVersion": 1,
      "position": [
        240,
        380
      ]
    },
    {
      "parameters": {
        "triggerTimes": {
          "item": [
            {
              "hour": 3
            }
          ]
        }
      },
      "id": "614948e0-dd81-4dc7-bd91-367e41b13718",
      "name": "3am every day",
      "type": "n8n-nodes-base.cron",
      "typeVersion": 1,
      "position": [
        240,
        200
      ]
    },
    {
      "parameters": {
        "databaseId": 48,
        "tableId": 206,
        "returnAll": true,
        "additionalOptions": {}
      },
      "id": "cc784d6a-a8ee-4e6c-9902-41a778367c57",
      "name": "Get all community node records",
      "type": "n8n-nodes-base.baserow",
      "typeVersion": 1,
      "position": [
        460,
        300
      ],
      "credentials": {
        "baserowApi": {
          "id": "91",
          "name": "[86-88] Baserow"
        }
      }
    },
    {
      "parameters": {
        "operation": "upsert",
        "sheetId": "1IrM3DB7gLBkug3OqHtFY_p-hbJWSwNrEML862wXxoo4",
        "range": "A:I",
        "options": {}
      },
      "id": "f6b41cd8-b2c5-4d02-b0c5-fe10f7e012f1",
      "name": "Update Google Sheet",
      "type": "n8n-nodes-base.googleSheets",
      "typeVersion": 2,
      "position": [
        680,
        300
      ],
      "credentials": {
        "googleSheetsOAuth2Api": {
          "id": "5",
          "name": "Sheets"
        }
      }
    }
  ],
  "connections": {
    "Start": {
      "main": [
        [
          {
            "node": "Get all community node records",
            "type": "main",
            "index": 0
          }
        ]
      ]
    },
    "3am every day": {
      "main": [
        [
          {
            "node": "Get all community node records",
            "type": "main",
            "index": 0
          }
        ]
      ]
    },
    "Get all community node records": {
      "main": [
        [
          {
            "node": "Update Google Sheet",
            "type": "main",
            "index": 0
          }
        ]
      ]
    }
  }
}
3 Likes

This should work, thanks sooooo muchhh!!! @joffcom I am getting an error though when trying to get the Table ID. Any clue why this could be happening or how to solve it? Thanks so much in advanced!

1 Like

Hey @shaping-horizons,

I would start off by making sure the credentials and the url is correct.

Hi @joffcom, thanks for the comment. They are correct, I guess, because n8n is reading the 4 databases we have in the baserow account. However, the issue comes with the Table Name or ID. There are no automatic tables shown in the dropdown. The error persists when I write the names of the different tables we have. Could it be something else?

Hey @shaping-horizons,

What version of n8n and Baserow are you using? It could be an issue with trailing slashes in the API call which we fixed in 0.187.0 which is not currently in the desktop release.

1 Like

Alright, that is the issue then. I was testing this with the desktop version. I will wait then till the new release comes out to test it out then or think how to do it with the online version. Thanks so much!

1 Like

Hey @shaping-horizons,

No problem, You could run it from npm instead which would allow you to do the same thing but desktop is often easier to get up and running with.

1 Like

Hey guys.

I would like to contribute to this specific topic. Please, see this Graphic mode in Baserow with python-baserow-client, plotly, here I explain step by step how to use two python libraries(python-baserow-client, plotly) to generate dynamic graphics without using third-party services with baserow.

This feature appears to be similar to this feature: Charts for Baserow data