- Name: Joseph Petty
- Role/Company: Developer Relations Engineer at Appsmith
- App Link: Baserow Explorer
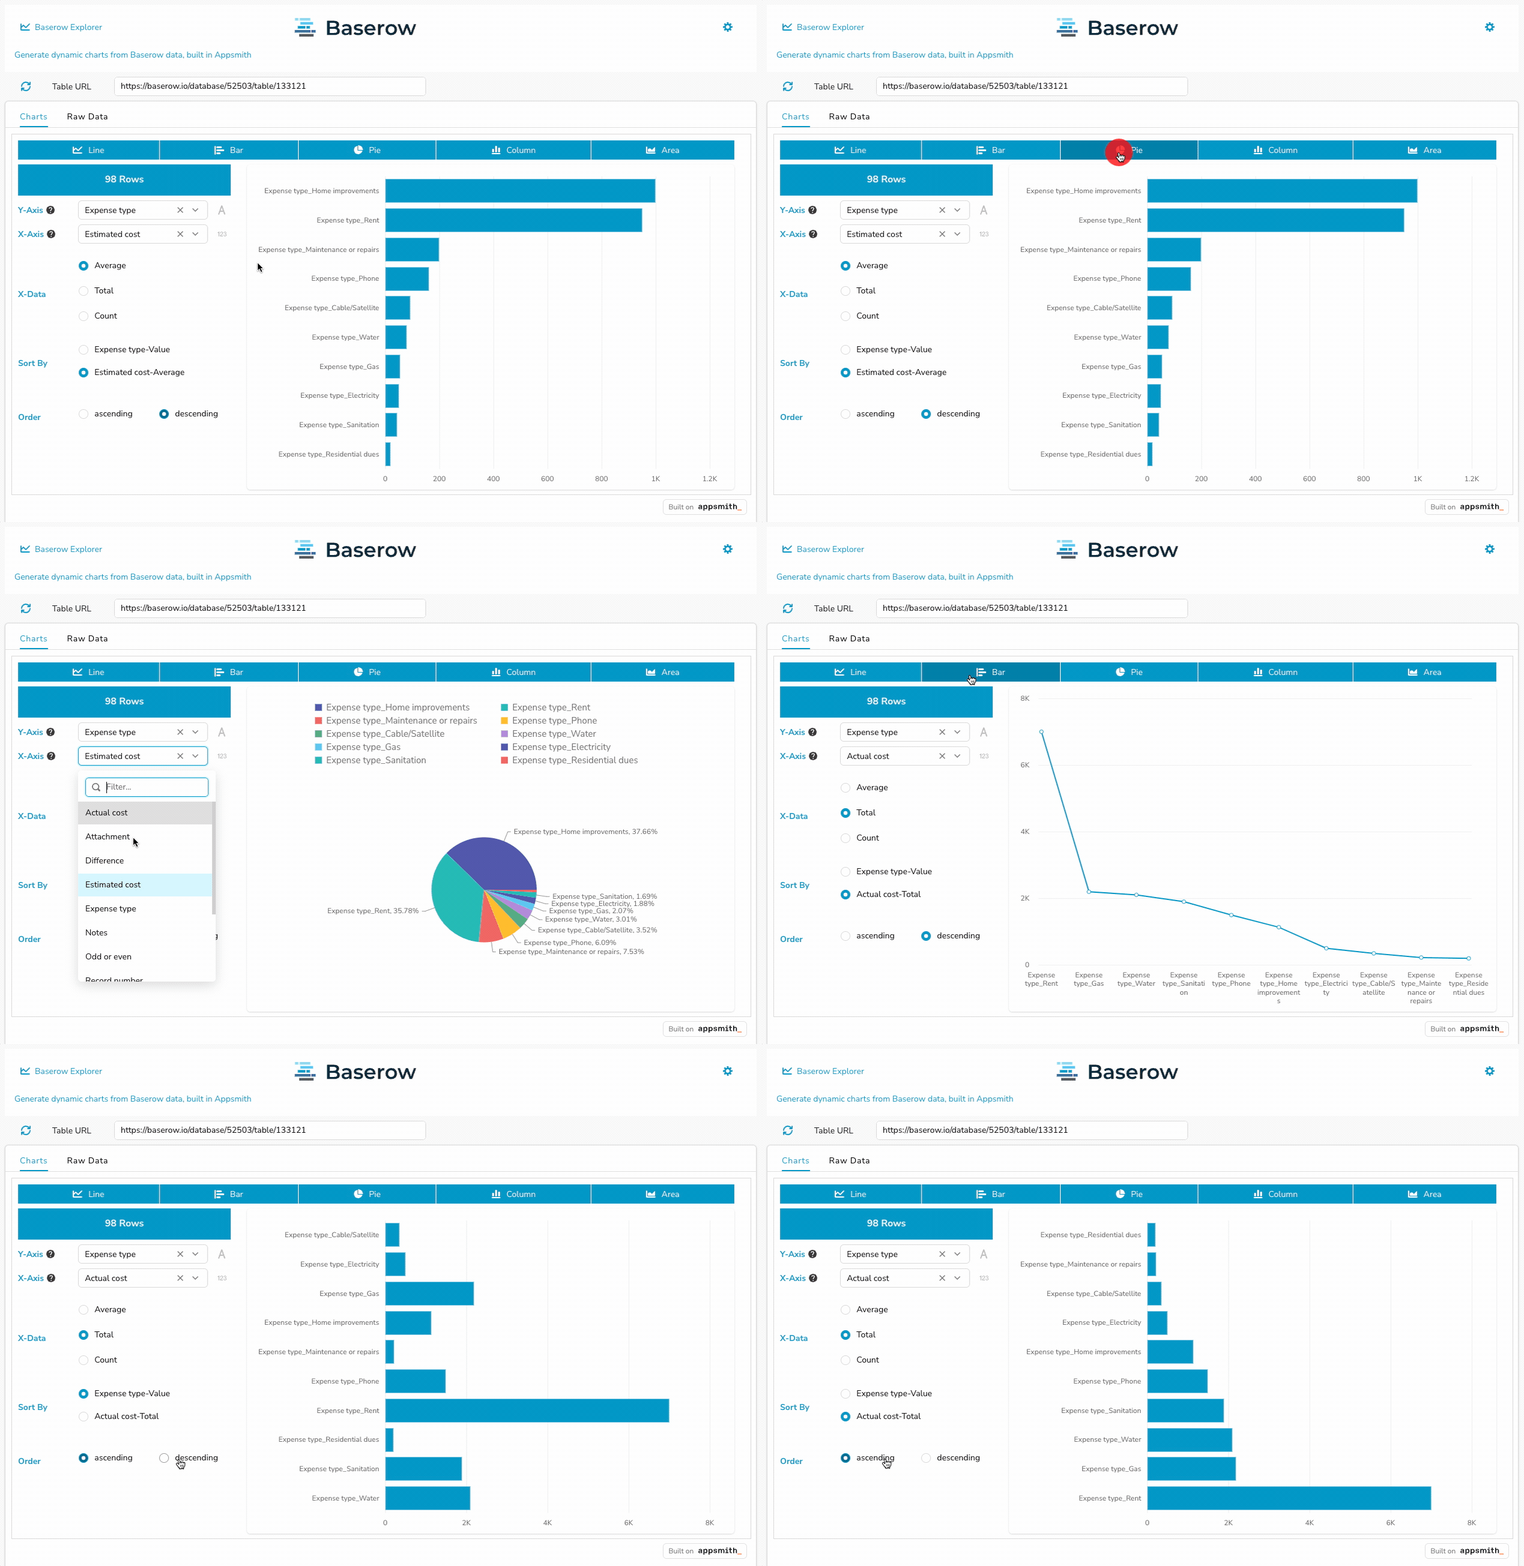
- Description: Generate charts from Baserow data, by selecting any column for the x and y axis, then choose Total, Average or Count, and select a chart type.
- Tools used: Baserow + Appsmith, and a few JavaScript nuggets
